


Fast and Accurate
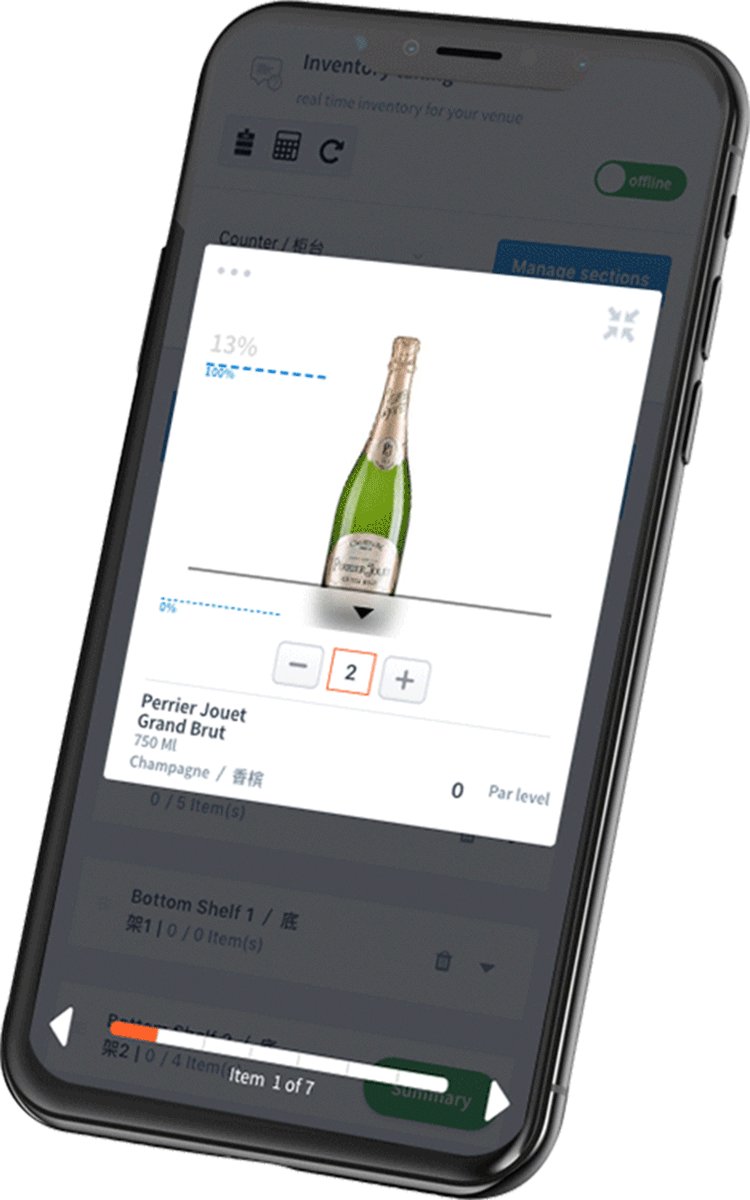
Our Inventory Taking Tool allows multiple bar and kitchen staff to simultaneously input inventory data using any type of device. All this data is instantly saved to the cloud.
Inventorying Prepped Items
No more skipping over or guesstimating items that you’ve already prepped. Simply count or weigh them to get an inventory that’s accurate to the gram.
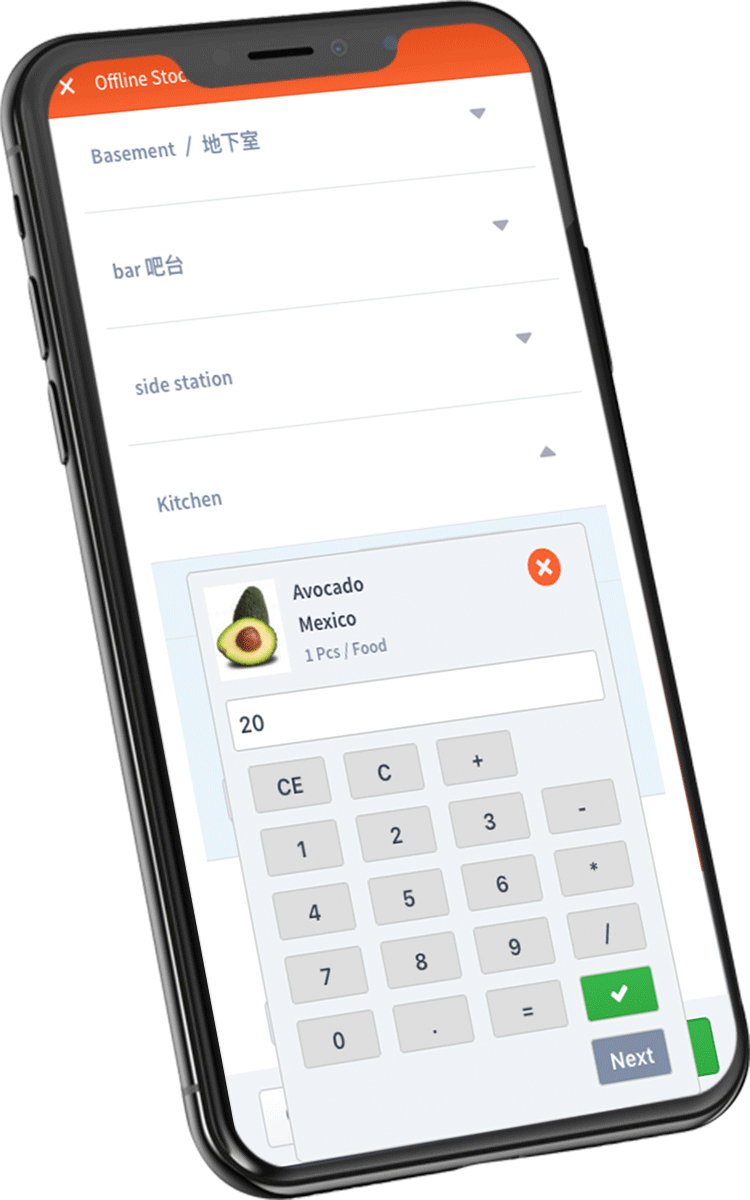
Offline Mode
No WiFi in your store room? No problem. Switch to Offline Mode and you are ready To take your inventory.


Group Operation Director Café des Stagiaires
“Thanks to Bevsight, it’s very easy to get an overview of the beverage cost of our venues and to figure out precisely where the problem is coming from to take corrective actions”

Owner and General Manager, Zapfler group
A must for every serious business
Bevsight helps you to solve problems that you did not know before !
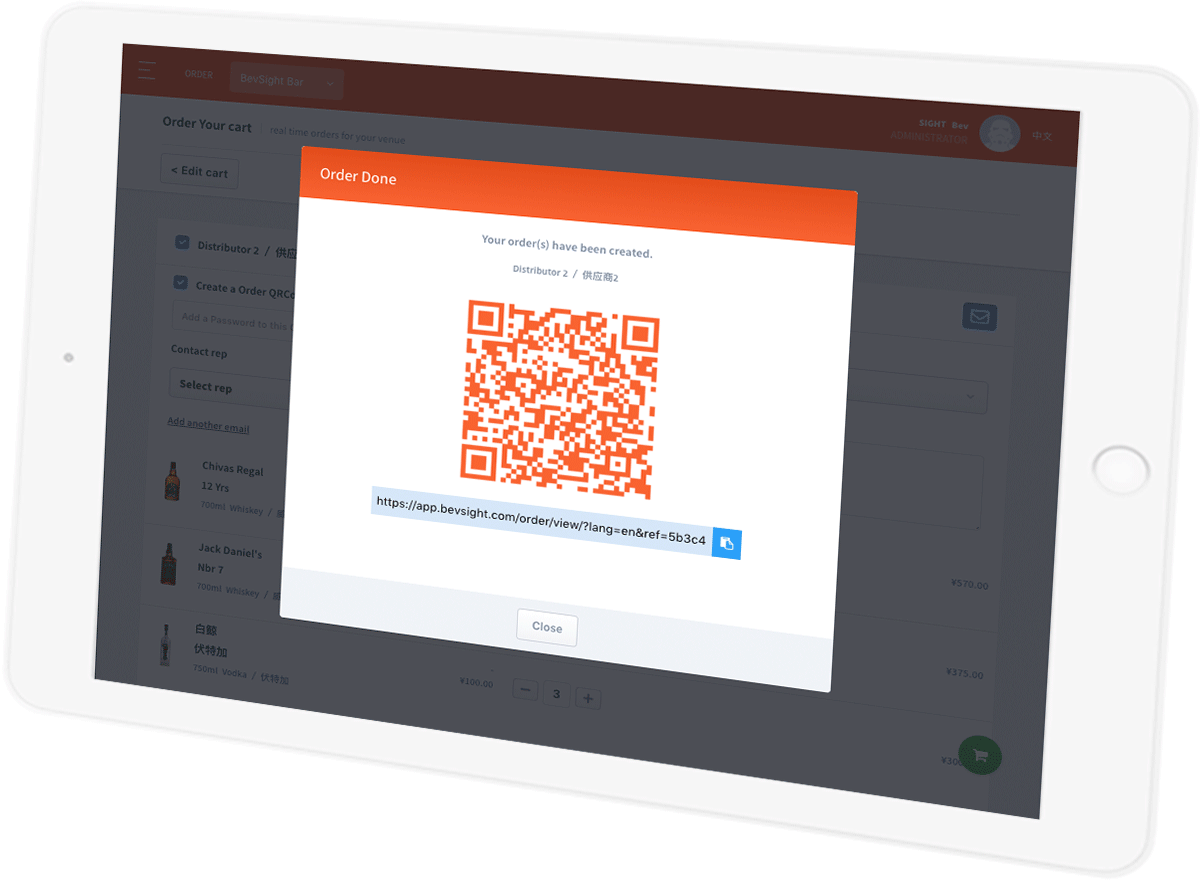
Smart Ordering
Order smarter by ordering exactly what you need. BevSight automatically suggests what you should order based on your current stock level and your usage history.
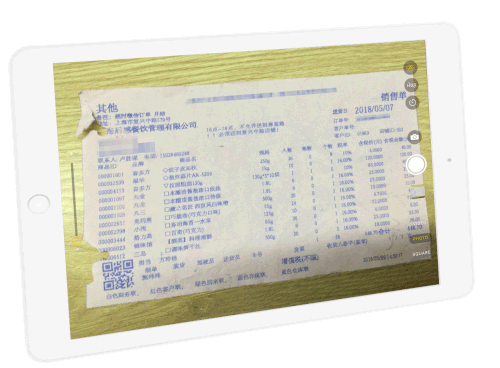
Reconcile Invoices
Handle receiving in a controlled manner and quickly compare received stock against your orders, snapping and uploading pictures of your invoices.
Online File Cabinet
All your data is organized and saved in one place, accessible anytime anywhere. This will rescue you and your accountant from hours of mundane paperwork.
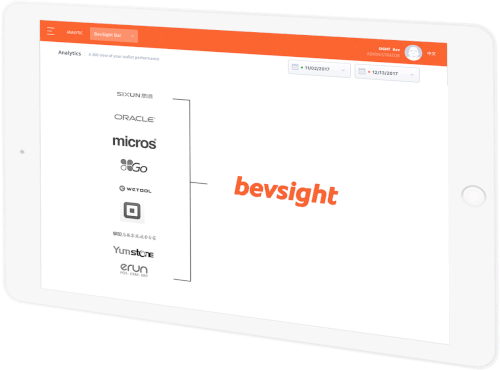
POS Integration
BevSight import itemized sales reports from any POS system.
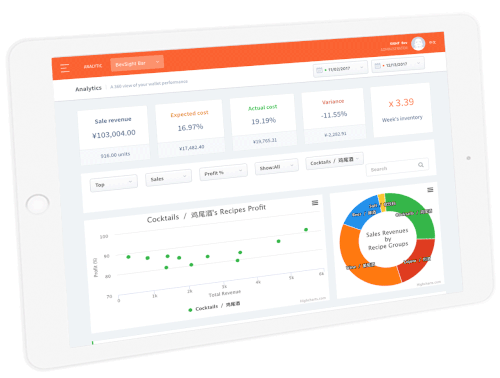
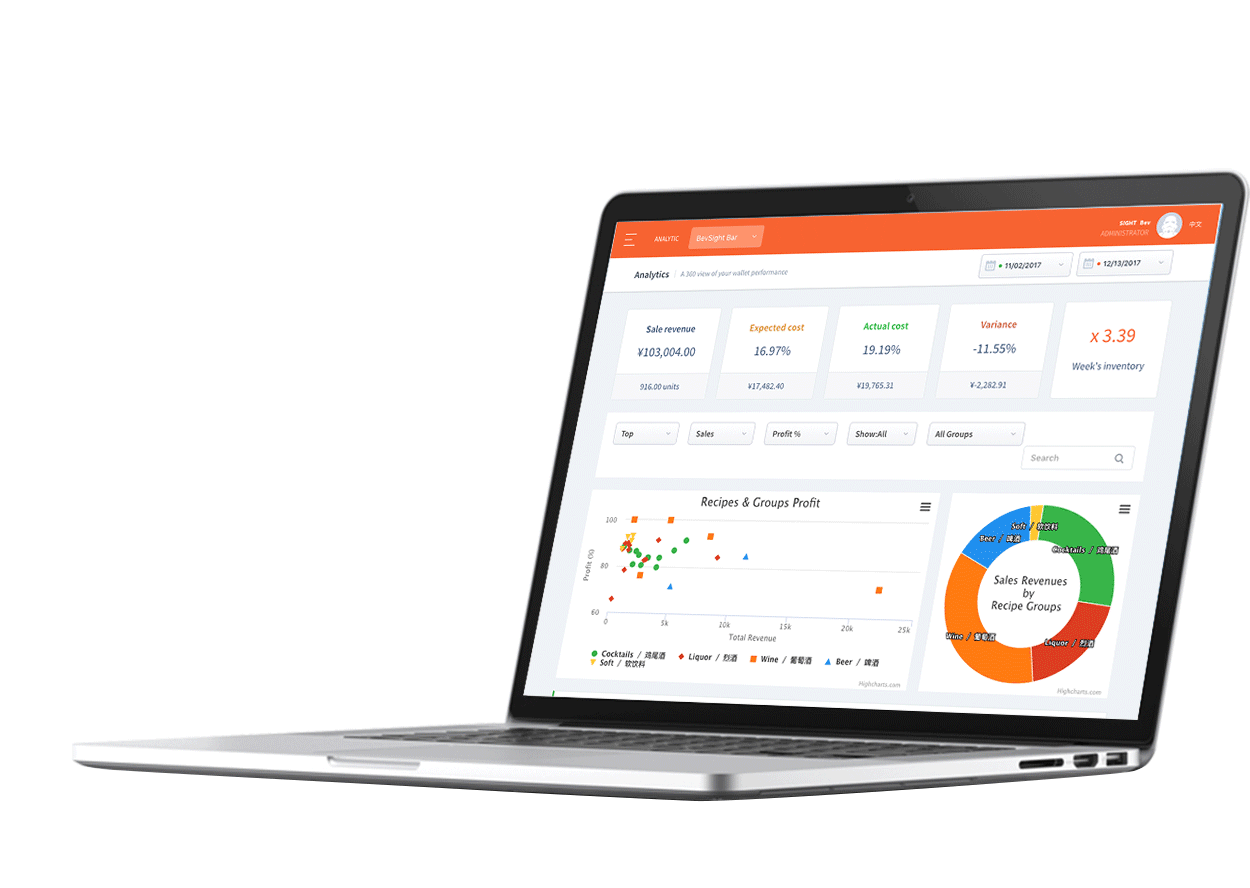
Sales Performance
Our interactive and easy to understand reports will help you to easily identify which item are yielding the desired profits and which item are not. Then you’ll be able to proactively adjust your menu to increase your profits.
Analytics
By automatically comparing your item sales reports against your accurate inventory count, you’ll receive a more detailed picture of your variance and will be able to see losses for individual items. This will allow you to more accurately understand where these factors are occurring and how to prevent them.
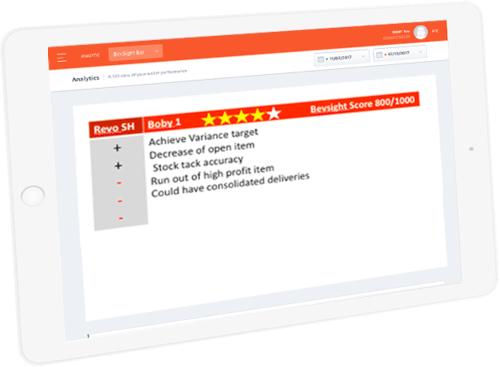
Human Metric
BevSight tracks user performance and then gives you simple and clear metrics to show areas of improvement and how you can use BevSight to your full advantage.
Customer Success Team
Your success is our job! We will be here to implement your product lists and item recipes, train your staff, and will provide reports to make sure you’re getting the most from your data. Best of all, all these services are free!